Performance Management Using KPIs
April 30, 2017 by Reece Tomlinson
In the second of a three-part series on ‘How to Maximise Clinic Performance’, global business executive Reece Tomlinson details how to utilise KPIs to boost clinic success
Key performance indicators evaluate the performance of the clinic or a particular function or activity within it.
The use of key performance indicators (KPIs) can help clinic owners, managers and employees effectively monitor the success of the various clinic functions and initiatives, which are essential to the achievement of the clinic’s objectives.
KPIs are a tool that any clinic can put into practice. Unlike simply receiving reports or analysing data from the various functions and initiatives of the clinic, KPIs are used to summarise relevant data and use the data to provide indicators of future performance. They offer the clinic the ability to review indicators which clinic owners, managers and employees can use to monitor success and, as importantly, make decisions.
The best way to think of a KPI report is as a dashboard report, which is the visual representation of your clinic’s indicators. A dashboard report can represent the performance of the entire clinic or the performance of specific functions and initiatives. They typically use a combination of leading and lagging indicators, which will be explained later in this article, to paint a picture of where things are heading.1 Implementing KPIs into the clinic does not need to be complex and can be done with relative ease. Below are some tips on how to implement KPIs as efficiently and effectively as possible.
Determine the right KPIs
The most influential KPIs are reliable at painting the picture between cause and effect. Michael J. Mauboussin, of Credit Suisse Group, a global financial services company, states that for KPIs to be effective they need to pass the test of being ‘persistent and predictive’.2 He asserts that a KPI needs to be persistent, meaning that the KPI measures a consistent set of input information, as well as predictive, meaning that there is a direct relationship between the action of the data being measured and the desired outcome (see example in point 1 below). To accurately determine the right KPIs to use, I would suggest you follow three steps, which I have developed from experience:
1. Define the objective
It is necessary to define the objective of the clinic, functional areas or initiatives. A clinic may choose, for example, that its objective is to grow sales. This chosen objective becomes the guiding principle behind all the KPIs of the clinic, functional areas or initiatives, which may include KPIs such as: year-to-date sales growth, re-booking rates and growth in average spend per customer etc. It is important to note, however, that the objective of the clinic needs to match the stated or implied strategy of the clinic in order to ensure it is moving closer to its goals.
2. Determine the ‘causal effect’ relationships of KPIs
It is important that KPIs are related to the objective. With each KPI, you should identify whether it has ‘causal effect’, meaning it is correlated towards the achievement of the objective of the clinic. If the clinic, for example, has identified that growing sales is its core objective, then KPIs such as customer satisfaction, re-booking rates and number of complaints etc, could arguably be indicators that, when acted upon, will help lead the clinic towards achieving the clinic’s objective.
3. Run a test
Using the KPIs you have identified, run a test using historical data over a specific period, such as prior months or year. Using prior data to generate KPIs based on historical information, while being impartial, determine whether the KPIs would prove capable of indicating success as it relates to the chosen objective of the company.
Use a combination of lagging vs leading KPIs
KPIs need to be a combination of lagging and leadings indicators. It is important to have the right balance of leading and lagging KPIs so that the clinic can accurately gauge historical performance and predict future performance. Regardless of whether the KPIs are being used for clinic, functional or initiative purposes; when the right balance is achieved, performance can be both accurately measured and predicted. It is also important to ensure that KPIs are a combination of financial and numbers-based (quantitative) and non-financial or non-numbers based (qualitative) indicators. Although I suggest using as much numbers-based data as possible; too much reliance on financial indicators can offer an incomplete view of the health of the clinic, which is important for sustainability. As a result, I suggest having at least one or two qualitative-based KPIs to be used within your dashboard report.
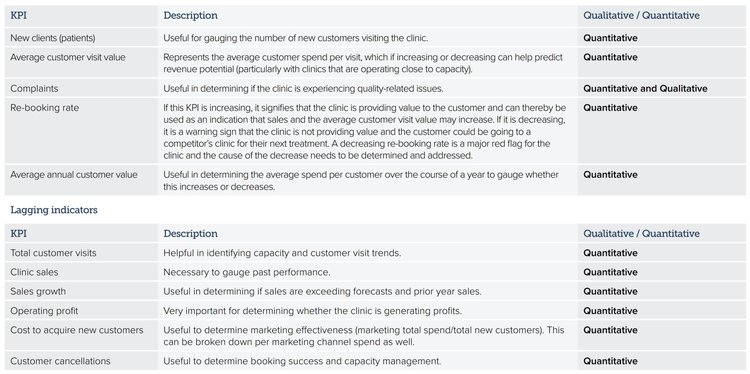
Lagging indicators
Lagging indicators are necessary because they provide the clinic with achieved results. For example, ‘operational profitability’ is a lagging indicator because it only provides data based on historical performance. Therefore, operational performance as an indicator is not always helpful in determining future performance because one period of profit generation cannot guarantee the next period will remain profitable.
Leading indicators
Leading indicators are important because they provide insight into where things should be heading. For example, ‘customer satisfaction’ is a leading indicator because it identifies how happy a customer was with their experience at the clinic. Accordingly, the higher the degree of customer satisfaction the higher the likelihood they will return for another treatment and likewise, the more people they will tell about it, which in theory, correlates to higher future revenues. ‘Customer rebooking rates’ can be considered another leading indicator because it should directly correlate to future revenue. The right number of KPIs The number of KPIs being used in a dashboard should be no less than six and, in my opinion, no more than 15, however, I suggest aiming for eight to twelve KPIs. For the average clinic, it is important for the dashboard report to be simple, easy to follow and concise. When the number of KPIs grows, the complexity of the report invariably grows, which can negate or hide the key information contained within the report that management needs to rely and act upon. In such situations, the clinic can create sub-dashboard reports for functional areas or specific initiatives.
Benchmark performance
Benchmarking performance against industry averages, which can be found at websites such as bizstats.com, and internal expectations is quintessential for monitoring whether an indicator is representing anything of value to the clinic. For example, if the clinic aims to grow sales by 10% for the year, the indicator of sales growth should clearly display whether the clinic is achieving the required sales growth for the period in which the indicator is measuring performance (weekly, bi-weekly, monthly, quarterly or yearly). In short, each KPI needs to be benchmarked against a set performance expectation.
Report format
There are two types of formats that I recommend the clinic can use for the dashboard reports containing KPIs. One format is an excel or table format and the other is a visual format.
Excel or table format
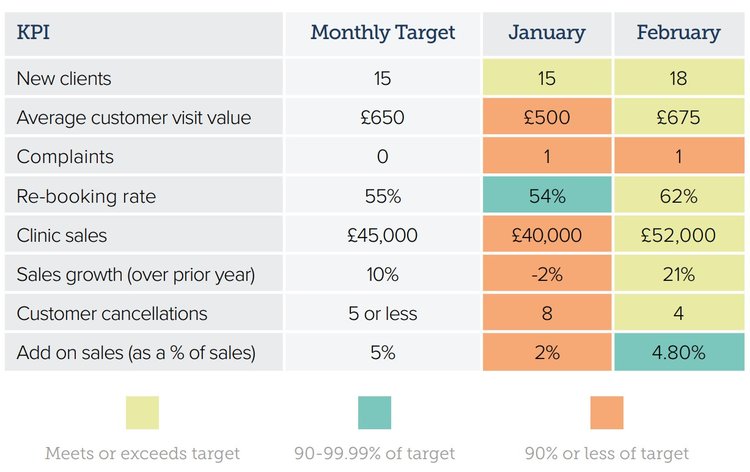
The excel or table format outlines the performance of each KPI in a very concise order while identifying whether the result has met or exceeded expectations (highlighted in green), is slightly lower than expectations (highlighted in yellow) or is below expectations (highlighted in red). Note, that each clinic may have their own definition of what meeting or exceeding, slightly lower than and below expectations actually means. To make it simple, I prefer to consider anything in green being meeting or exceeding expectations, anything highlighted in yellow to be between 90- 99.99% of expectations and anything highlighted in red to be below 90% of expectations. The table format is easy to create, easy to manage and may look something like the below report
Visual format
The visual format outlines the performance of each KPI using visuals such as dials, gauges and graphs, and is typically more customised to be visually appealing. In fact, the term ‘dashboard report’ comes from the visuals often used in such reports, which appear similar to that of an automobile dashboard. Although it can be produced in Excel, this format is more difficult to create so some practitioners may choose to invest in third party technology companies such as; idashboards, Sisense and Notion. The benefits of using a third-party dashboard technology is largely tied around the ability to provide simpler-appearing reports, which are more visually appealing and easier for employees, at all levels of the organisation, to follow. An example of a visual dashboard report is below:
Management
Managing KPIs does not have to be a complex undertaking. In many ways, the KPI report is an assimilation of data already produced by the clinic itself and should not add a huge amount of time to the clinic accounting manager or clinic manager. In situations where the clinic does not have an accounting manager or clinic manager, focus on producing only KPIs that are critical to success. I would recommend producing weekly, monthly and quarterly reports, which should be reviewed with your management team on a regular basis to identify and act upon positive and negative indicators. Providing dashboard reports and KPIs to the company can be a great way of engaging employees. When the dashboard reports contain KPIs, which are clearly linked to the stated strategy of the clinic, they can become a company-wide performance measurement tool, which every employee can clearly see, utilise and understand. It should be noted, that based on the degree of open book management within the clinic, certain KPIs such as sales, profitability and those associated with cash generation, should be left to higher level dashboard reports for management and clinic owners.
Summary
In summary, KPIs and dashboard reports offer the clinic the ability to increase the utilisation of data while providing a tool that allows data to become a means of regularly monitoring performance. Through taking action as a result of the KPIs and dashboard reports, they ensure a clinic’s success against its objectives. I would encourage clinic owners/managers to implement KPIs and dashboard reports as they can dramatically improve transparency and create a greater ease of understanding of what the data is telling you and your employees.
Fuelling big growth
Custom capital solutions designed to grow your business to the next level. We help navigate the complexities of business when the stakes are high.